Saturday, March 30, 2024
Monday, March 18, 2024
Sunday, March 17, 2024
Monday, March 11, 2024
Sunday, December 25, 2022
Wednesday, December 14, 2022
LEARNING OUTCOMES
To understand the skewness and kurtosis
To understand various types of skewness and kurtosis and their properties
Tuesday, December 13, 2022
SKEWNESS AND KURTOSIS
Skewness and kurtosis
Skewness
If the values of a specific
independent variable (feature) are skewed, depending on the model, skewness may
violate model assumptions or may reduce the interpretation of feature
importance.In statistics, skewness is
a degree of asymmetry observed in a probability distribution that deviates from
the symmetrical normal distribution (bell
curve) in a given set of data. The normal
distribution helps to know skewness. When we talk about normal distribution,
data symmetrically distributed. The symmetrical distribution has zero skewness
as all measures of a central tendency lies in the middle.
When data is symmetrically distributed, the left-hand
side, and right-hand side contain the same number of observations. (If the
dataset has 90 values, then the left-hand side has 45 observations, and the
right-hand side has 45 observations.). That data is called asymmetrical data,
and that time skewness
Positive skewed or right skewed. In statistics, a positively skewed
distribution is a sort of distribution where, unlike symmetrically
distributed data where all measures of the central tendency (mean, median, and
mode) equal each other, with positively skewed data, the measures are
dispersing, which means Positively Skewed Distribution is a type of
distribution where the mean, median, and mode of the distribution are positive
rather than negative or zero.
The figure showing positive skewness

In positively skewed, the mean of the data is greater than the
median (a large number of data-pushed on the right-hand side). In other words,
the results are bent towards the lower side. The mean will be more than the
median as the median is the middle value and mode is always the highest value.The
extreme positive skewness is not desirable for distribution, as a high level of
skewness can cause misleading results. The data transformation tools are
helping to make the skewed data closer to a normal distribution. For positively
skewed distributions, the famous transformation is the log transformation. The
log transformation proposes the calculations of the natural logarithm for each
value in the dataset.
Negative skewed or left-skewed.A negatively skewed distribution is the straight reverse of a positively skewed distribution. In statistics, negatively skewed distribution refers to the distribution model where more values are plots on the right side of the graph, and the tail of the distribution is spreading on the left side.In negatively skewed, the mean of the data is less than the median (a large number of data-pushed on the left-hand side). Negatively Skewed Distribution is a type of distribution where the mean, median, and mode of the distribution are negative rather than positive or zero.
The figure showing negative distribution
Median is the middle value, and mode is the highest value, and due to unbalanced distribution median will be higher than the mean.
Kurtosis
Kurtosis refers to the degree of presence of outliers in the distribution.Kurtosis is a statistical measure, whether the data is heavy-tailed or light-tailed in a normal distribution.Kurtosis refers to the degree of presence of outliers in the distribution.
Figure 3
The
figure showing kurtosis

In finance, kurtosis
is used as a measure of financial risk. A large kurtosis is associated with a
high level of risk for an investment because it indicates that there are high
probabilities of tails of the distribution instead of around
the mean.
Leptokurtic (kurtosis > 3)
Leptokurtic is having very long and
skinny tails, which means there are more chances of outliers. Positive values
of kurtosis indicate that distribution is peaked and possesses thick tails. An
extreme positive kurtosis indicates a distribution where more of the numbers
are located in the tails of the distribution instead of around the mean.
Figure 4
The figure showing leptokurtic

Platykurtic (kurtosis
< 3)
Platykurtic
having a lower tail and stretched around center tails means most of the data
points are present in high proximity with mean. A platykurtic distribution is
flatter (less peaked) when compared with the normal distribution.
Figure 5
The figure showing platykurtic

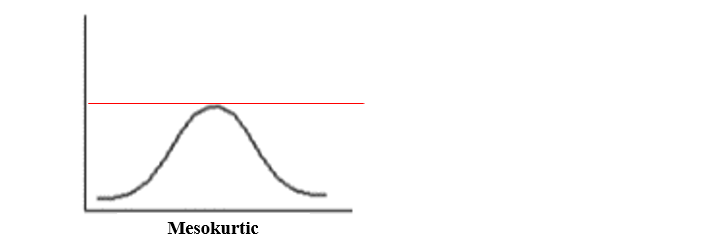
Mesokurtic (kurtosis =
3)
Mesocratic
is the same as the normal distribution, which means kurtosis is near to 0. In Mesocratic,
distributions are moderate in breadth, and curves are a medium peaked height.
Figure 6
The figure showing mesokurtic
Summary
Table 1
Table showing skewness and kurtosis
|
Skewness |
kurtosis |
|
measure of symmetry or
asymmetry |
measures whether data is
heavy-tailed or light-tailed |
|
positive-skewed and
negatively skewed |
Leptokurtic
,Mesokurtic,platykurtic |